**Litecoin’s Volatility Hits Record Lows, Signaling Imminent Bullish Breakout**
Litecoin’s volatility has dropped to its lowest levels ever, positioning the cryptocurrency above key support zones and setting the stage for a potential strong breakout. Technical analysis reveals a bullish setup, highlighted by consolidation within a triangle pattern on the weekly chart.
Historical data shows that similar low-volatility periods in Litecoin’s price action have often led to major rallies. Experts are forecasting gains of up to 190% from current price levels, signaling robust upside potential. Currently trading near $98, Litecoin’s breakout appears imminent as volatility compression tightens.
—
### What Is Causing Litecoin’s Imminent Breakout as Volatility Hits Record Lows?
The prospects for a Litecoin breakout are strengthening as the asset experiences unprecedented low volatility around the $98 mark. This compression is evident in technical indicators such as the Bollinger Bands, which suggest that an explosive price move could be on the horizon.
Sustained support above critical levels and historical precedents of sharp rallies following similar volatility contractions underpin this bullish outlook. Analysts — including certified market technicians — point to recent bullish candle formations that signal potential gains, aiming for significantly higher price thresholds.
—
### How Do Bollinger Bands Signal Litecoin’s Bullish Momentum?
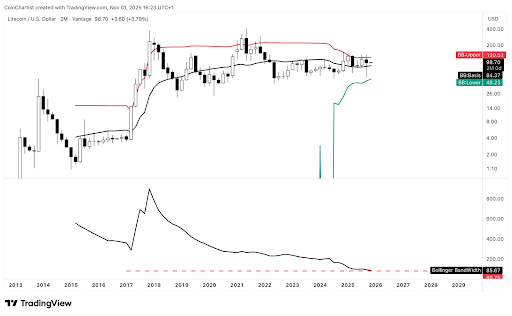
Litecoin’s Bollinger Bands currently show the following levels:
– Upper Band: $120.52
– Middle Band: $84.37
– Lower Band: $48.23
The price is positioned above the middle band, indicating short-term strength. Moreover, the Bollinger Band width reading is at 85.67 — the tightest in Litecoin’s trading history compared to past peaks exceeding 800. Such narrowed bands often suggest reduced market fluctuations that typically precede major breakouts.
Tony Severino, CMT, shared insights on social media, highlighting that the two-month Bollinger Band width has set record lows, reflecting the least volatile period in LTCUSD history. He observed that despite a recent downward wick, the two-month candle closed as a Hammer above the Bollinger Band basis, which is a bullish technical signal.
Severino emphasized that a close above $120 by the end of 2025 could trigger a definitive buy signal, consistent with patterns seen in earlier market cycles.
—
### Litecoin’s Historical Context and Current Stability
Since its inception in 2013, Litecoin has navigated multiple market phases, demonstrating resilience throughout. Particularly since 2022, the cryptocurrency has consolidated within a narrower range, gradually rebuilding momentum and gaining in stability.
This historical context supports the current narrative that Litecoin is poised for a breakout. Low volatility periods have repeatedly preceded upward price expansions, reinforcing the bullish technical setup.
Recent market data further validates this view. Litecoin gained 3.79% against the U.S. dollar in short-term charts, trading at approximately $98.70. The alignment of analyses across multiple timeframes strengthens the expectation of continuation, with Litecoin holding firm above critical support zones that have proven reliable during past recoveries.
—
### Analysts Predict Strong Price Targets Ahead
**Price Targets for a Litecoin Breakout:**
– Initial target: $140
– Subsequent targets: $180 and $285
These targets derive from the completion of bullish patterns, such as the ABCDE structure and triangle consolidation. They also take into account historical rally percentages and ongoing technical squeezes, indicating a potential upside exceeding 190% from current levels.
However, analysts emphasize the importance of volume confirmation to validate these breakout moves.
—
### Is Litecoin’s Low Volatility a Reliable Predictor of Future Gains?
Yes. Litecoin’s record-low volatility has historically preceded significant price movements. Past cycles where the Bollinger Bands tightened have led to rallies exceeding 300%.
Combined with the formation of bullish Hammer candles and sustained support above the middle Bollinger Band, this pattern suggests mounting pressure for an upward breakout. This makes volatility compression a crucial signal for traders monitoring Litecoin’s long-term trends.
—
### Key Takeaways
– **Record-Low Volatility:** Litecoin’s Bollinger Band width is at historic lows, signaling an impending major move similar to setups that preceded past bull runs.
– **Bullish Technical Indicators:** The Hammer candle close and price above the middle band provide strong upward momentum, with experts like Tony Severino forecasting clear buy signals above $120.
– **Analyst Consensus on Targets:** Industry analysts such as Jonathan Carter and The Penguin project price targets of $140, $180, and $285, urging traders to watch for breakout confirmations on higher timeframes.
—
### Conclusion
Litecoin’s current trading near $98 combined with record-low volatility primes it for a potential breakout. This is supported by Bollinger Band analysis and expert insights from seasoned analysts including Tony Severino, Jonathan Carter, and The Penguin.
As Litecoin consolidates above crucial support levels and mirrors historical bullish patterns, the outlook remains optimistic for substantial price gains. Investors and traders should closely monitor forthcoming candle closes for confirmation signals, preparing for what may become a transformative rally in the Litecoin market.
—
*Stay tuned for the latest updates as Litecoin nears a critical technical squeeze, potentially unlocking significant bullish momentum in the coming months.*
https://bitcoinethereumnews.com/tech/litecoins-record-low-volatility-signals-potential-bullish-breakout-toward-140/?utm_source=rss&utm_medium=rss&utm_campaign=litecoins-record-low-volatility-signals-potential-bullish-breakout-toward-140