
The cryptocurrency is currently trading around $2. 19, up approximately 2. 9% over the past 24 hours, with a 24-hour volume of $6. 2 billion. This price action places XRP close to the psychologically significant $2 support level, an area closely monitored by analysts and investors amid periods of consolidation and heightened market volatility. Technical Outlook: 100 WEMA in Focus XRP’s weekly chart indicates a retest of the 100-week Exponential Moving Average (WEMA) at approximately $1. 90, the first since its breakout in November 2024. This moving average coincides with the Supertrend indicator, creating a technical confluence that historically can act as a stabilizing support zone. “RP has the potential to turn the 100 WEMA into support. This is the first retest of this moving average since the break above in Nov 2024,” noted independent market analyst @ChartNerdTA, who focuses on trend-based models and medium-term technical analysis. XRP tests the 100-week WEMA near $1. 90, aligned with Supertrend support, marking its first retest since November 2024. Historical fractals, like those seen in 2017, are included as reference points; however, these patterns are illustrative rather than predictive, given that market conditions and liquidity differ across cycles. On-Chain Activity: Whales in Focus On-chain data shows notable activity from large XRP holders, often referred to as whales. Over the past 72 hours, addresses holding between 1 million and 10 million XRP reduced their holdings by over 180 million tokens, coinciding with a 17% price surge. “While RP jumped 17% in the last 72 hours, whales used the move to lock in profits,” reported @ali_charts, who monitors blockchain metrics and supply concentration. XRP jumps 17% in 72 hours as whales sell over 180M tokens to lock in profits. 3 billion XRP in mid-October to about 4. 7 billion by late November. While this may reflect profit-taking, historical analyses suggest whale activity sometimes aligns with consolidation bottoms, depending on the broader accumulation trend. Providing context, traders often interpret whale reductions cautiously: the move does not inherently drive price direction but offers insight into market sentiment and liquidity distribution. Key Support and Resistance Levels XRP’s current technical range highlights critical support between $1. 90 and $2. 00, with immediate resistance at $2. 35-$2. 45. These levels are derived from historical price reactions and trendline analysis, providing context for short-term market behavior. XRP rebounds from $2 support, hinting that the 2017 fractal pattern may still be influencing price action. 90-$2. 00 Resistance: $2. 35-$2. 45 Potential extension scenario: ~$4 (based on historical consolidation patterns and prior swing highs, but not a guaranteed target) The support zone is crucial for near-term stability. A breach below this range could prolong consolidation or trigger short-term weakness, while a sustained hold may indicate balanced supply-demand dynamics. Market Implications For traders and investors, XRP’s retest of the $2 support and 100 WEMA presents a scenario-based inflection point rather than a definitive forecast: Scenario 1: Holding above $2 may allow consolidation and gradual upward momentum, assuming liquidity conditions remain supportive. Scenario 2: Falling below $1. 90 could lead to extended consolidation or pressure toward lower support, emphasizing the need for cautious position sizing. Integrating technical and on-chain insights offers a broader risk framework, encouraging market participants to consider multiple signals rather than relying solely on short-term price moves. Final Thoughts XRP is navigating a delicate balance between support and resistance, with the 100-week WEMA providing a key reference for trend assessment. While whale activity and historical fractals provide context, these factors should be interpreted as part of a wider analytical approach rather than deterministic predictors. XRP was trading at around $2. 18, up 2. 91% in the last 24 hours at press time.
https://bitcoinethereumnews.com/tech/xrp-price-today-xrp-gains-above-2-support-and-tests-100-wema-signaling-potential-bullish-reversal/
Tag Archives: consolidation


Pi Coin Price Pattern Points to a Rally as Top Whale Hits 381M Milestone
Pi Coin price has done well during the ongoing crypto crash as it outperformed popular coins like Solana, Cardano, and Binance Coin (BNB). Pi Network remained in a tight range as these coins plunged. This consolidation could usher in a rebound as its biggest whale hits a crucial milestone. Pi Coin Price Double Bottom Pattern Has Formed The daily chart shows that the Pi Coin price has remained in a tight range since October this year. A closer look shows that the token has formed a double-bottom pattern at $0. 2025. It has remained below this level since its October 10 crash when liquidations in the industry soared. A double-bottom is a highly bullish pattern made up of two downswings and a neckline. In this case, the neckline is at $0. 2921, its highest level in October this year. Pi Network price has other bullish catalysts. For example, the three lines of the Bollinger Bands have narrowed, which could spark a short squeeze in the near term. Most importantly, the coin is in the accumulation stage of the Dow Theory, which is marked by continued consolidation. The next stage is known as the markup phase, which is characterized by high demand and Fear of Missing Out (FOMO). Therefore, the most likely Pi Network price forecast is bullish, with the initial target being the double-bottom’s neckline at $0. 2920. A move above that level will point to more gains, potentially to the psychological level at $0. 50. A move to that level will be a 110% surge from the current level. However, a plunge below the double-bottom point at $0. 2025 will invalidate the bullish outlook. Pi Network Whale Hits a Crucial Milestone The potential Pi Coin price forecast is backed by the ongoing whale buying despite the ongoing crypto market crash. Data shows that the top whale bought over 2. 7 million tokens worth over $637,470. This purchase happened after he bought 375, 214 coins on Sunday. The ongoing purchasing has brought his Pi holdings to over 381 million, with a current value of $91 million. A move to $0. 50 as we predicted would bring his total holdings to worth over $190 million. The whale purchases has coincided with some important Pi Network news. For example, Pi Network has applied for MICA approval, a move that would make it available to millions of users in the region. The other bullish news was its investment in OpenMind, a fast-growing player in the AI and robotics industry. Pi Network has also launched multiple upgrades to the App Studio and the node. It is also launching a new DEX platform that will boost its network activity.
https://bitcoinethereumnews.com/crypto/pi-coin-price-pattern-points-to-a-rally-as-top-whale-hits-381m-milestone/


BTC Price Prediction: Sharp Rebound to $95,000-$100,000 by December 2025
BTC Price Prediction: Technical Setup Points to December Recovery BTC Price Prediction Summary • BTC short-term target (1 week): $88,000-$90,000 (+4-7% from current levels) • Bitcoin medium-term forecast (1 month): $95,000-$100,000 range • Key level to break for bullish continuation: $90,000 resistance • Critical support if bearish: $80,600 (strong support level) Recent Bitcoin Price Predictions from Analysts The latest BTC price prediction landscape reveals a divided analyst community. While CoinLore’s short-term Bitcoin forecast projects a decline to $83,176 by November 23rd, their long-term outlook remains aggressively bullish with a BTC price target of $195,067 by 2026. This stark contrast highlights the uncertainty in current market conditions. Derive. xyz presents a more conservative view, suggesting a 50% probability that Bitcoin will end 2025 below $90,000, with only a 30% chance of breaking $100,000. However, Fundstrat’s Sean Farrell offers the most compelling contrarian perspective, identifying Bitcoin’s approach to a critical value zone that could trigger a sharp rebound. The consensus among these predictions suggests that while near-term weakness is possible, the technical setup increasingly favors a recovery scenario, particularly given Bitcoin’s oversold conditions. BTC Technical Analysis: Setting Up for Oversold Bounce The current Bitcoin technical analysis reveals compelling evidence for an imminent reversal. With the RSI plunging to 22. 49, Bitcoin has entered deeply oversold territory not seen since major market bottoms. Historical analysis shows that RSI readings below 25 have consistently marked significant buying opportunities for BTC. The MACD histogram at -1290. 35 confirms bearish momentum, but the divergence between price action and RSI suggests this selling pressure may be nearing exhaustion. Bitcoin’s position at 0. 02 within the Bollinger Bands indicates the price is hugging the lower band support at $83,869. 92, a classic setup for mean reversion toward the middle band at $97,571. Volume analysis from Binance shows $2. 27 billion in 24-hour trading, indicating sufficient liquidity to support a meaningful bounce. The daily ATR of $4,396. 80 suggests that any reversal could produce significant price movements in either direction. Bitcoin Price Targets: Bull and Bear Scenarios Bullish Case for BTC The primary BTC price prediction scenario targets a recovery to $95,000-$100,000 within 4-6 weeks. This Bitcoin forecast is based on several technical factors converging simultaneously. First, the oversold RSI condition typically resolves with a 15-25% bounce, which would place Bitcoin near $97,000. Second, a reclaim of the 20-day SMA at $97,571 would confirm the reversal and open the path to test the previous consolidation zone. For this bullish scenario to materialize, Bitcoin needs to break above $90,000 decisively, which represents both the immediate resistance and the psychological barrier identified in recent analyst reports. A successful break would likely trigger short covering and renewed institutional buying, potentially driving the BTC price target toward $100,000. Bearish Risk for Bitcoin The alternative scenario sees Bitcoin breaking below the critical $80,600 support level, which could trigger a cascade toward $76,000-$78,000. This bearish Bitcoin forecast would invalidate the oversold bounce thesis and suggest that the current weakness reflects fundamental rather than technical selling pressure. Key risk factors include potential regulatory concerns, macroeconomic headwinds affecting risk assets, and continued outflows from Bitcoin ETFs. If the $80,600 support fails, the next significant level lies near the 52-week low at $76,322, representing a potential 9-10% decline from current levels. Should You Buy BTC Now? Entry Strategy Based on the current Bitcoin technical analysis, a staged entry approach appears optimal. The immediate BTC price prediction suggests waiting for either a bounce from current levels or a break below $80,600 before taking action. For aggressive buyers, initial positions could be established near $83,000-$84,000 with stop-losses below $80,000. Conservative investors should wait for confirmation above $88,000-$90,000 before entering, as this would signal the beginning of the predicted recovery phase. Position sizing should reflect the elevated volatility, with risk management paramount given the conflicting analyst forecasts. Consider scaling into positions rather than making large single entries, particularly given the mixed sentiment in current BTC price predictions. BTC Price Prediction Conclusion The weight of technical evidence supports a medium-confidence prediction that Bitcoin will rebound toward $95,000-$100,000 by late December 2025. The oversold RSI, Bollinger Band positioning, and historical precedent for bounces from these levels provide the foundation for this Bitcoin forecast. However, the $80,600 support level represents the critical make-or-break point for this prediction. A decisive break below this level would invalidate the bullish scenario and suggest deeper weakness ahead. Key indicators to monitor include RSI divergences, volume confirmation on any bounce attempts, and the market’s reaction to the $90,000 resistance level. The timeline for this BTC price prediction to materialize extends through December 2025, with initial confirmation expected within the next 1-2 weeks if the oversold bounce scenario unfolds as anticipated. Image source: Shutterstock.
https://Blockchain.News/news/20251122-price-prediction-btc-sharp-rebound-to-95000-100000-by


Worldcoin Extends Its Downtrend as Open Interest Falls and Price Stabilization Attempts Remain Weak
The asset remains near multi-month lows as momentum weakens across both spot and leveraged markets, offering limited evidence of a near-term trend reversal. Open Interest Declines as Price Forms Lower Lows on the 1H Chart Open interest in WLD derivatives has steadily decreased over recent sessions, mirroring the asset’s consistent downtrend on the 1-hour timeframe. After posting levels above 83. 5M, open interest slid toward the 82M range during the sharp decline between the 12th and 14th, indicating that traders were closing positions rather than adding new short pressure. Source : Open Interest & Price Action The 1H chart shows a textbook bearish structure, with lower highs and lower lows forming from November 10 onward. While price experienced a slight stabilization near the 17th-18th, the recovery has been shallow, producing small-bodied candles and wicks that signal indecision rather than renewed buying strength. The mild uptick in open interest during the consolidation phase suggests early positioning-potentially accumulation or short covering-but the magnitude remains too small to shift market structure. For now, the combination of falling price and reduced leveraged exposure underscores a market still in de-risking mode, lacking the conviction needed for a meaningful reversal. WLD Trades at $0. 67 as Market Cap Holds Above $1. 56 Billion According to BraveNewCoin data, Worldcoin is currently trading at $0. 67, reflecting a -1. 50% decline over the past 24 hours. The project’s market capitalization is reported at $1, 569, 369, 054, supported by $182, 784, 361 in daily trading volume. Circulating supply is recorded at 2, 331, 503, 775 tokens, placing Worldcoin at Rank 73 by market capitalization. Despite the controlled pullback, intraday price ranges remain tight, and liquidity flows show moderation. Worldcoin’s subdued session reflects a broader theme of consolidation and low volatility, with spot metrics providing no clear signal of bullish momentum returning in the short term. Daily Chart Shows Multi-Month Breakdown and Bearish Continuation TradingView’s WLD/USDT daily chart reveals a prolonged downward trajectory extending from earlier highs near $1. 80 in June. After a strong rally in early summer, the asset shifted into an extended consolidation range from June through August, with reduced volatility indicating hesitation among market participants. The coin now trades around $0. 67, near its yearly lows, with elevated sell-side volume confirming persistent bearish sentiment. Volatility remains moderate, and no major reversal structure has yet formed. Price continues to trend downward in alignment with weakening momentum, while the overall pattern reflects a slow grind lower rather than sudden capitulation.
https://bitcoinethereumnews.com/tech/worldcoin-extends-its-downtrend-as-open-interest-falls-and-price-stabilization-attempts-remain-weak/


Hyperliquid (HYPE) Price Prediction: Compression Nears Breakout With Targets Sitting at $48 and $54
Hyperliquid’s momentum is starting to quietly rebuild, with fresh signs of strength appearing across both technicals and on-chain activity. As price holds steady in a tight consolidation range, whale accumulation, rising relative performance, and improving lower-timeframe structure all hint that HYPE may be preparing for its next major move. On-Chain Activity Shows Bullish Momentum Whale behavior is beginning to shift, with on-chain metrics shared from CryptoQuant showing that larger wallets have steadily absorbed HYPE during recent dips. The pattern aligns with early accumulation phases, as exchange outflows are rising, active large addresses have increased, and the average transaction size continues to trend upward. These metrics typically appear when sophisticated players position ahead of a volatility expansion. The broader narrative here is that even while HYPE’s spot price has cooled, whale-led demand remains firm beneath the surface. When on-chain flows strengthen during periods of weakness, upside reactions tend to happen quickly once liquidity conditions shift. Relative Strength Improving Against Majors HYPE continues to show impressive relative strength when measured against BTC, ETH, SOL, and even BNB. Mogie’s charts highlight higher lows building across most pairs, with HYPE/BTC pushing into a minor breakout and HYPE/ETH defending its range low cleanly. These relative strength trends often appear before major upside pivots. HYPE is outperforming BTC, ETH, SOL, and BNB with steady higher lows across key pairs, highlighting clear relative strength. Relative performance outpacing four major assets is a strong indication of internal strength, and historically, HYPE rallies began this same way. Lower-Timeframe Structure Building Strength Lower-timeframe structure shows a rounded-bottom pattern forming again, similar to the previous major reversal that sent HYPE sharply higher. Price continues to hold the $35 to $38 accumulation band, while the RSI is curling upward from the mid-range, indicating improving demand after extended consolidation. HYPE is forming a rounded-bottom pattern on lower timeframes while holding the $35-$38 accumulation zone, signaling early strength. If the pattern completes, HYPE Hyperliquid price could attempt another mid-range push towards $42-$45, where the next supply zone sits. Breakout Setup Tightening as Compression Nears End A clean symmetrical triangle has formed, with price being squeezed between descending trendline resistance and a rising support line from the recent lows. Each compression cycle has produced higher local lows, showing buyers gradually pushing upward despite lower volatility. HYPE is compressing inside a symmetrical triangle, with rising lows signaling mounting breakout pressure as price approaches key resistance. A move above the $40 to $41 diagonal resistance would confirm bullish continuation, potentially opening a run towards $48 and $54. The setup now looks very close to resolution. Community Sentiment Remains Strong The broader HYPE community remains confidently bullish, with sentiment consistently favoring a return towards the $60 region. Henrik’s comment reflects a widely shared belief among early adopters and long-term holders that the current consolidation is temporary before the next expansion wave. If technical conditions align with the sentiment backdrop, a push towards the mid-$50s to $60 range becomes a realistic Hyperliquid Price Prediction for the next major leg. HYPE’s community sentiment stays firmly bullish. Whale accumulation provides a strong foundation, relative outperformance against majors reinforces underlying demand, and both lower-timeframe structures and compression setups point toward an imminent volatility break. While nothing is confirmed until resistance breaks, HYPE remains one of the few assets displaying coordinated strength across technical and on-chain fronts. A decisive move above the triangle could quickly shift momentum back into a full bullish phase.
https://bitcoinethereumnews.com/tech/hyperliquid-hype-price-prediction-compression-nears-breakout-with-targets-sitting-at-48-and-54/


Crypto News Today: Dogecoin’s Rhythmic Surge May Target $0.30 Before Year-End As This $0.035 Altcoin Targets $5 in 2 Years
Currently, the DeFi space is expanding alongside a growing range of investment opportunities. Pioneering DeFi protocols, along with established memecoins, are setting the pace on the blockchain in unique and lucrative ways. With Dogecoin aiming for potential targets of $0.30, investors are closely monitoring trading opportunities in this memecoin.
Simultaneously, there is increasing analytical interest in presale offers like Mutuum Finance (MUTM), a decentralized lending platform that presents a compelling investment case.
**Dogecoin’s Technical Trajectory**
Experienced market analysts have identified signs of a cyclical recovery in the Dogecoin market. Historically, May and October have seen price expansions, often following consolidation periods. Patterns suggest that the June consolidation was also succeeded by a price increase. Currently, Dogecoin is at a critical resistance level. If the price remains steady, breakout patterns could signal impulsive market behavior ahead.
The market structure is supported by major players and sustained buying trends, increasing the likelihood of a Dogecoin breakout beyond $0.30 within the year. This could lead to a breakout consolidation phase, further boosting Dogecoin’s market momentum.
**Presale Access to Mutuum Finance: Last Chance to Join at the Bottom**
While Dogecoin garners most of the attention, Mutuum Finance (MUTM) offers a different—and arguably larger—investment opportunity. The presale has raised over $18.75 million with 18,010 holders so far. Currently in Phase 6, MUTM tokens are sold at $0.035, representing a 250% increase from the $0.010 price in Phase 1. This indicates strong ongoing demand for the project.
Phase 6 is rapidly filling, with more than 90% allocated, making this the last chance to purchase MUTM tokens at this price. After this phase, the price will rise to $0.040 in Phase 7—a nearly 20% increase. The project’s target launch price is $0.06, meaning early investors could enjoy up to 400% profits. This opportunity is quickly slipping away for latecomers.
**Giving Back to the Community**
Mutuum Finance emphasizes community participation as a core pillar. The project features a live 24-hour leaderboard tracking the top 50 holders. The top daily participant—who completes at least one transaction—receives a $500 MUTM bonus. The leaderboard resets daily at 00:00 UTC, encouraging consistent engagement.
Additionally, acquiring MUTM tokens has never been easier. Investors can purchase with a card, and there are no purchase limits. These features help generate buzz and attract early attention before the project adopts more competitive practices typical of established markets.
**A Vision for Exponential Returns**
Understanding a project’s fundamentals is essential for predicting its growth. Mutuum Finance’s future-oriented vision is grounded in the comprehensive fundamentals of its dual-market lending ecosystem. The planned integration of an over-collateralized native stablecoin enhances its sustainability and growth potential.
Based on these factors, price predictions suggest that Mutuum Finance could reach $5 within two years. Its solid fundamentals, market fit, and clear roadmap position it as one of the most promising new crypto coins. A deep understanding of the project’s core value is key to its long-term success.
**Seize the Momentous Opportunity**
The crypto market rewards those who identify and act on potential early. Currently, buying Dogecoin presents an opportunity ahead of a possible price spike. However, Mutuum Finance stands out as a future-focused investment in innovative DeFi technology.
The window to participate in Phase 6 at $0.035 is closing quickly—it’s the last chance to get in before prices increase. For long-term gains, investing in Mutuum Finance—supported by its innovative model, aggressive presale traction, and promising price targets—makes a compelling case.
**The time to act is now.**
For more information about Mutuum Finance (MUTM), visit the links below:
**Website: Linktree**
https://bitcoinethereumnews.com/crypto/crypto-news-today-dogecoins-rhythmic-surge-may-target-0-30-before-year-end-as-this-0-035-altcoin-targets-5-in-2-years/
PEPE Price Prediction: Targeting $0.000005-$0.0000065 Range Through December 2025
**PEPE Price Prediction Summary**
– **Short-term target (1 week):** $0.000005 (–17% from current levels)
– **Medium-term forecast (1 month):** $0.000005 – $0.0000065 trading range
– **Key bullish level to break:** $0.0000067
– **Critical bearish support:** $0.0000043
—
### Recent PEPE Price Predictions from Analysts
Multiple cryptocurrency analysts have aligned on a bearish PEPE price outlook for the remainder of November 2025. CoinCodex leads this consensus, targeting $0.000006 in the short term. Their prediction is supported by 85% of technical indicators flashing bearish signals and the Fear & Greed Index sitting low at 26, indicating widespread market fear.
AMB Crypto’s forecast echoes this sentiment, projecting PEPE to trade within a corridor between $0.0000056 and $0.0000065, with $0.000006 as the midpoint target. The most pessimistic view comes from Changelly, expecting PEPE to decline to $0.00000528, while The Bit Journal provides the widest range between $0.0000043 and $0.0000062.
Overall, analyst consensus reveals a clear bearish bias across major forecasting platforms. However, some sources hint at potential recovery depending on shifts in broader market sentiment. This convergence suggests institutional money managers may be positioning defensively around PEPE holdings.
—
### PEPE Technical Analysis: Setting Up for Consolidation
The current technical picture for PEPE shows a cryptocurrency caught between opposing forces. With an RSI of 32.89, PEPE sits in neutral territory but leans toward oversold conditions, potentially setting up a short-term relief bounce.
Meanwhile, the MACD histogram remains negative at –0.0000, confirming lingering bearish momentum controlling price action. PEPE trades near the lower Bollinger Band at 0.11, historically acting as temporary price support.
The Stochastic oscillator shows %K at 16.67 and %D at 12.09 — deeply oversold levels that suggest a short-term bounce could occur within the next few trading sessions.
Looking at volume, Binance reports $38.3 million in 24-hour trading activity. This moderate volume is below levels typically seen during strong directional moves, indicating price action currently lacks conviction for a sustained breakout, either up or down.
—
### PEPE Price Targets: Bull and Bear Scenarios
**Bullish Case for PEPE**
An optimistic price scenario targets a recovery toward the $0.0000065 – $0.0000067 range if key conditions are met:
– PEPE must reclaim the middle Bollinger Band, signaling a shift away from lower-band trading.
– RSI needs to rise above 50 to indicate momentum is turning bullish.
– Trading volume should exceed $50 million daily on Binance, confirming institutional buying interest.
Key resistance levels to watch are $0.0000058 (initial resistance) and $0.0000065 (strong resistance). A decisive break above $0.0000067 would invalidate the current bearish structure and likely pave the way for the next resistance zone.
**Bearish Risk for PEPE**
On the downside, immediate risk targets $0.000005, aligning with CoinCodex’s projection. Breaking below this level could trigger algorithmic selling and drive PEPE down toward $0.0000043—the most bearish scenario from The Bit Journal.
Warning signs include a daily RSI falling below 30, which would confirm worsening oversold conditions, and the MACD histogram deepening further into negative territory.
The critical support at $0.0000043 represents a 28% decline from current levels and could coincide with overall weakness in the meme coin sector.
—
### Should You Buy PEPE Now?
**Entry Strategy**
Given current market conditions, a cautious approach is advised. The technical setup favors dollar-cost averaging rather than aggressive position building.
Ideal entry points may occur on any bounce toward the $0.0000058 – $0.000006 range. Traders can consider establishing positions here with tight stop-losses set just below $0.000005.
Risk management is essential in this volatile environment. Position sizing should not exceed 2-3% of your total portfolio, and stop-losses can be placed at $0.0000048 to limit downside exposure.
For existing holders, it may be prudent to take partial profits above $0.0000062 while maintaining core positions for potential longer-term gains.
The current outlook suggests PEPE is more likely to trade sideways within the $0.000005 – $0.0000065 range through December 2025, making range-bound trading strategies more appropriate than directional bets.
—
### PEPE Price Prediction Conclusion
The comprehensive analysis points toward a consolidation phase for PEPE through the remainder of 2025, with a slight bearish bias.
The target trading range of $0.000005 – $0.0000065 carries medium confidence based on both technical indicators and analyst consensus. The RSI hovering near 32.89 provides some downside protection, while negative MACD momentum discourages aggressive bullish positions.
Key indicators to monitor for a trend change include:
– Daily RSI moving above 40 (bullish signal) or dropping below 25 (bearish signal)
– MACD histogram turning positive
– Sustained daily volume exceeding $45 million on Binance
This technical setup is expected to resolve within 2–3 weeks, with December 2025 likely providing clearer directional signals to guide positioning for 2026.
Traders should prepare for continued volatility and prioritize risk management over directional speculation until stronger technical indications emerge for a sustained trend.
https://bitcoinethereumnews.com/tech/pepe-price-prediction-targeting-0-000005-0-0000065-range-through-december-2025/


XRP Price Prediction: Targeting $2.79 Short-Term with $3.10 Medium-Term Breakout Potential
**XRP Price Prediction Summary**
– **XRP short-term target (1 week):** $2.79 (+15.3%)
– **Ripple medium-term forecast (1 month):** $2.62 – $3.10 range
– **Key level to break for bullish continuation:** $2.70
– **Critical support if bearish:** $2.07
—
### Recent Ripple Price Predictions from Analysts
The latest XRP price prediction consensus from leading analysts reveals a cautiously optimistic outlook for Ripple’s native token.
CoinEdition’s technical analysis supports a **$2.79 short-term target**, citing consolidation above exponential moving averages (EMAs) and rising open interest as key bullish indicators. This aligns closely with our current Ripple forecast based on XRP’s technical positioning above EMA 12 at $2.40.
BTCC’s more aggressive XRP price prediction of **$3.10** represents the upper end of realistic medium-term expectations, requiring XRP to break through critical resistance between $2.50 and $2.60.
Meanwhile, AInvest’s ambitious **$7** target based on fractal patterns appears overly optimistic given the current market structure, though it highlights the potential for significant upside if institutional adoption accelerates.
The most conservative approach comes from CoinLore’s **$2.62** Ripple forecast, which aligns well with historical price patterns and provides a realistic baseline for the next 10-day period.
—
### XRP Technical Analysis: Setting Up for Bullish Continuation
Current Ripple technical analysis reveals a **neutral-to-bullish setup**, with XRP trading at $2.42 — positioned strategically between key moving averages.
– The **RSI reading of 48.39** sits in neutral territory, providing room for upward movement without entering overbought conditions.
– The **MACD histogram’s positive reading of 0.0153** signals emerging bullish momentum.
– XRP trades within the middle portion of its Bollinger Bands at a 0.45 position, suggesting it has broken out of oversold conditions but hasn’t yet reached resistance levels that typically trigger profit-taking.
Volume analysis shows healthy participation, with **$262.6 million in 24-hour Binance spot volume**, supporting the validity of the current price action. The daily Average True Range (ATR) of **$0.17** indicates moderate volatility, creating opportunities for measured price movements toward the XRP price target levels.
—
### Ripple Price Targets: Bull and Bear Scenarios
#### Bullish Case for XRP
The primary XRP price target of **$2.79** represents a 15.3% gain from current levels, supported by the convergence of technical indicators and analyst consensus.
For this scenario to materialize, XRP must first break above immediate resistance at **$2.70**, which coincides with the upper Bollinger Band at $2.71. A successful breach of $2.70 would likely trigger momentum toward the medium-term Ripple forecast target of **$3.10**, representing a 28% upside potential.
This bullish scenario requires sustained volume above current levels and RSI advancement into the 55-60 range without triggering overbought selling pressure.
The most optimistic scenario, targeting **$5.85 – $10**, would require a fundamental shift in market sentiment and significant institutional adoption catalysts — making it a lower-probability outcome within the forecast timeframe.
#### Bearish Risk for Ripple
Downside risks emerge if XRP fails to hold current support levels.
– The immediate support at **$2.07** represents the first critical test.
– A break below this level could trigger a decline toward the strong support zone at **$1.25**.
– The bearish scenario would be confirmed by RSI dropping below 45 and the MACD histogram turning negative.
Such conditions would invalidate the current XRP price prediction and suggest a retest of the 52-week low region around $1.80.
—
### Should You Buy XRP Now? Entry Strategy
Based on current Ripple technical analysis, the optimal entry strategy involves **scaling into positions on any dips toward $2.36 – $2.40**, aligning with the SMA 7 and EMA 12 support levels.
This approach allows investors to buy or sell XRP based on technical confirmation rather than emotional decision-making. Risk management should include stop-loss orders below **$2.07** to limit downside exposure to 14–15%.
Position sizing should remain conservative given the medium confidence level in current predictions, with investors allocating no more than **2–5% of their portfolio** to XRP positions.
For traders seeking higher conviction entries, waiting for a breakout above **$2.70** with volume confirmation provides better risk-adjusted opportunities, though it sacrifices potential upside if the XRP price prediction materializes from current levels.
—
### XRP Price Prediction Conclusion
Our comprehensive analysis supports a medium confidence XRP price prediction targeting **$2.79 within the next 7–10 days**, with potential extension toward **$3.10 over the next month**.
The Ripple forecast hinges on maintaining support above $2.36 and achieving a volume-confirmed breakout above $2.70.
Key indicators to monitor for prediction validation include:
– RSI advancement above 52
– MACD histogram maintaining positive momentum
– Sustained trading above EMA 12 at $2.40
Invalidation signals would include a break below $2.07 support or RSI declining below 45.
The timeline for this XRP price prediction extends through **December 2025**, with the most critical period occurring in the next two weeks as the token attempts to establish itself above key resistance levels.
Investors should remain flexible and adjust positions based on technical confirmation rather than rigid adherence to price targets.
—
*Image source: Shutterstock*
https://Blockchain.News/news/20251112-price-prediction-xrp-targeting-279-short-term-with-310

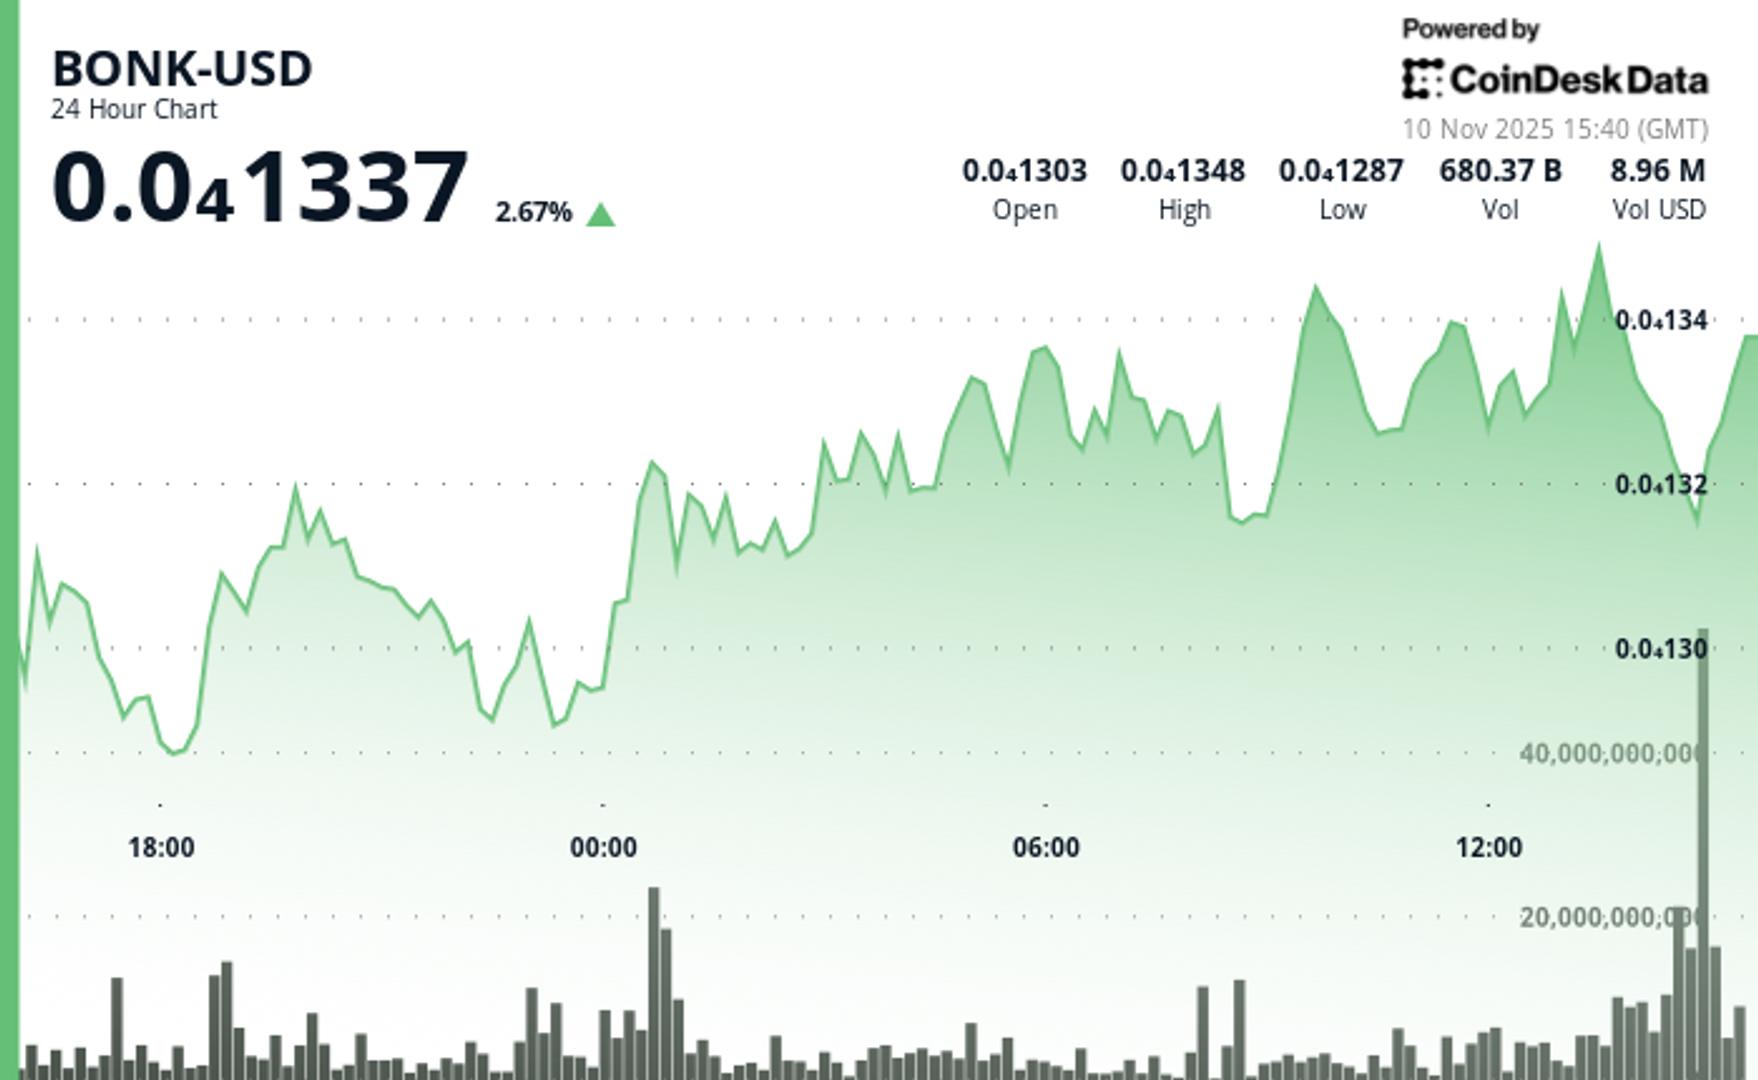
BONK Rises 1.7% as Breakout Momentum Holds
BONK gained 1.7% to $0.00001332 in the last 24 hours, extending its recent breakout move while testing higher resistance levels. The Solana-based meme token traded within a tight upward channel after decisively breaking through the $0.00001320 threshold, sustaining its bullish structure amid moderate volatility, according to CoinDesk Research’s technical analysis data model.
Volume provided strong technical confirmation of the move, with 850.8 billion tokens traded—an 82% increase above the daily average of 467 billion. Intraday data revealed a series of rapid surges, including a 14.2 billion-token spike during the late-session rally phase, followed by moderate pullback activity as short-term profit-taking emerged.
BONK remains positioned within an ascending channel structure, supported by higher lows forming around the $0.00001300 to $0.00001327 range. This suggests continued consolidation potential before the next directional move.
Technical indicators point to a stable mid-channel alignment near $0.00001332. For renewed upside momentum, sustained volume above 500 billion tokens and a confirmed break over the $0.00001350 resistance level will be required.
https://www.coindesk.com/markets/2025/11/10/bonk-rises-1-7-to-usd0-00001332-as-breakout-momentum-holds
XRP Price Soars 12% After US Senate Vote
The recent political relief in Washington has removed a key element of uncertainty that had been weighing on risk assets. As government operations resume, expectations are rising for improved liquidity flows and renewed spending confidence—factors that often translate into bullish momentum for cryptocurrencies like Bitcoin (BTC), Ethereum (ETH), and XRP.
**XRP Price Analysis: Key Levels and Bullish Momentum**
On the 2-hour XRP/USDT chart, a strong breakout is evident, with XRP surging above the critical $2.45 resistance level (highlighted by the yellow line). This level has now flipped into support, indicating a robust short-term uptrend. The token is currently trading well above both the 200 SMA ($2.44) and the 21 EMA ($2.34), further confirming bullish momentum.
The Stochastic RSI stands near the overbought zone at 98.45, suggesting that while momentum is strong, a brief cooldown or consolidation may occur before the next upward leg. As long as XRP holds above $2.45, bulls may target the next resistance zone around $2.70. On the downside, support is found at $2.20—an area of previous consolidation and a key level for buyers to watch in case of a pullback.
**XRP Price Prediction: Political Calm and Renewed Risk Appetite**
The Senate’s recent decision is being viewed as a bullish macro trigger, one that could help stabilize financial markets as we head into mid-November. This political calm is boosting risk appetite, with traders positioning themselves ahead of fresh economic data releases and upcoming Federal Reserve communications. Both factors will likely shape the next major move for the crypto market.
Stay tuned as XRP continues to show strong momentum, and key macro events provide additional fuel for the ongoing bullish trend.
https://bitcoinethereumnews.com/tech/xrp-price-soars-12-after-us-senate-vote/