Category Archives: climate

Can New York Democrats even DELAY the energy crisis their laws are creating?

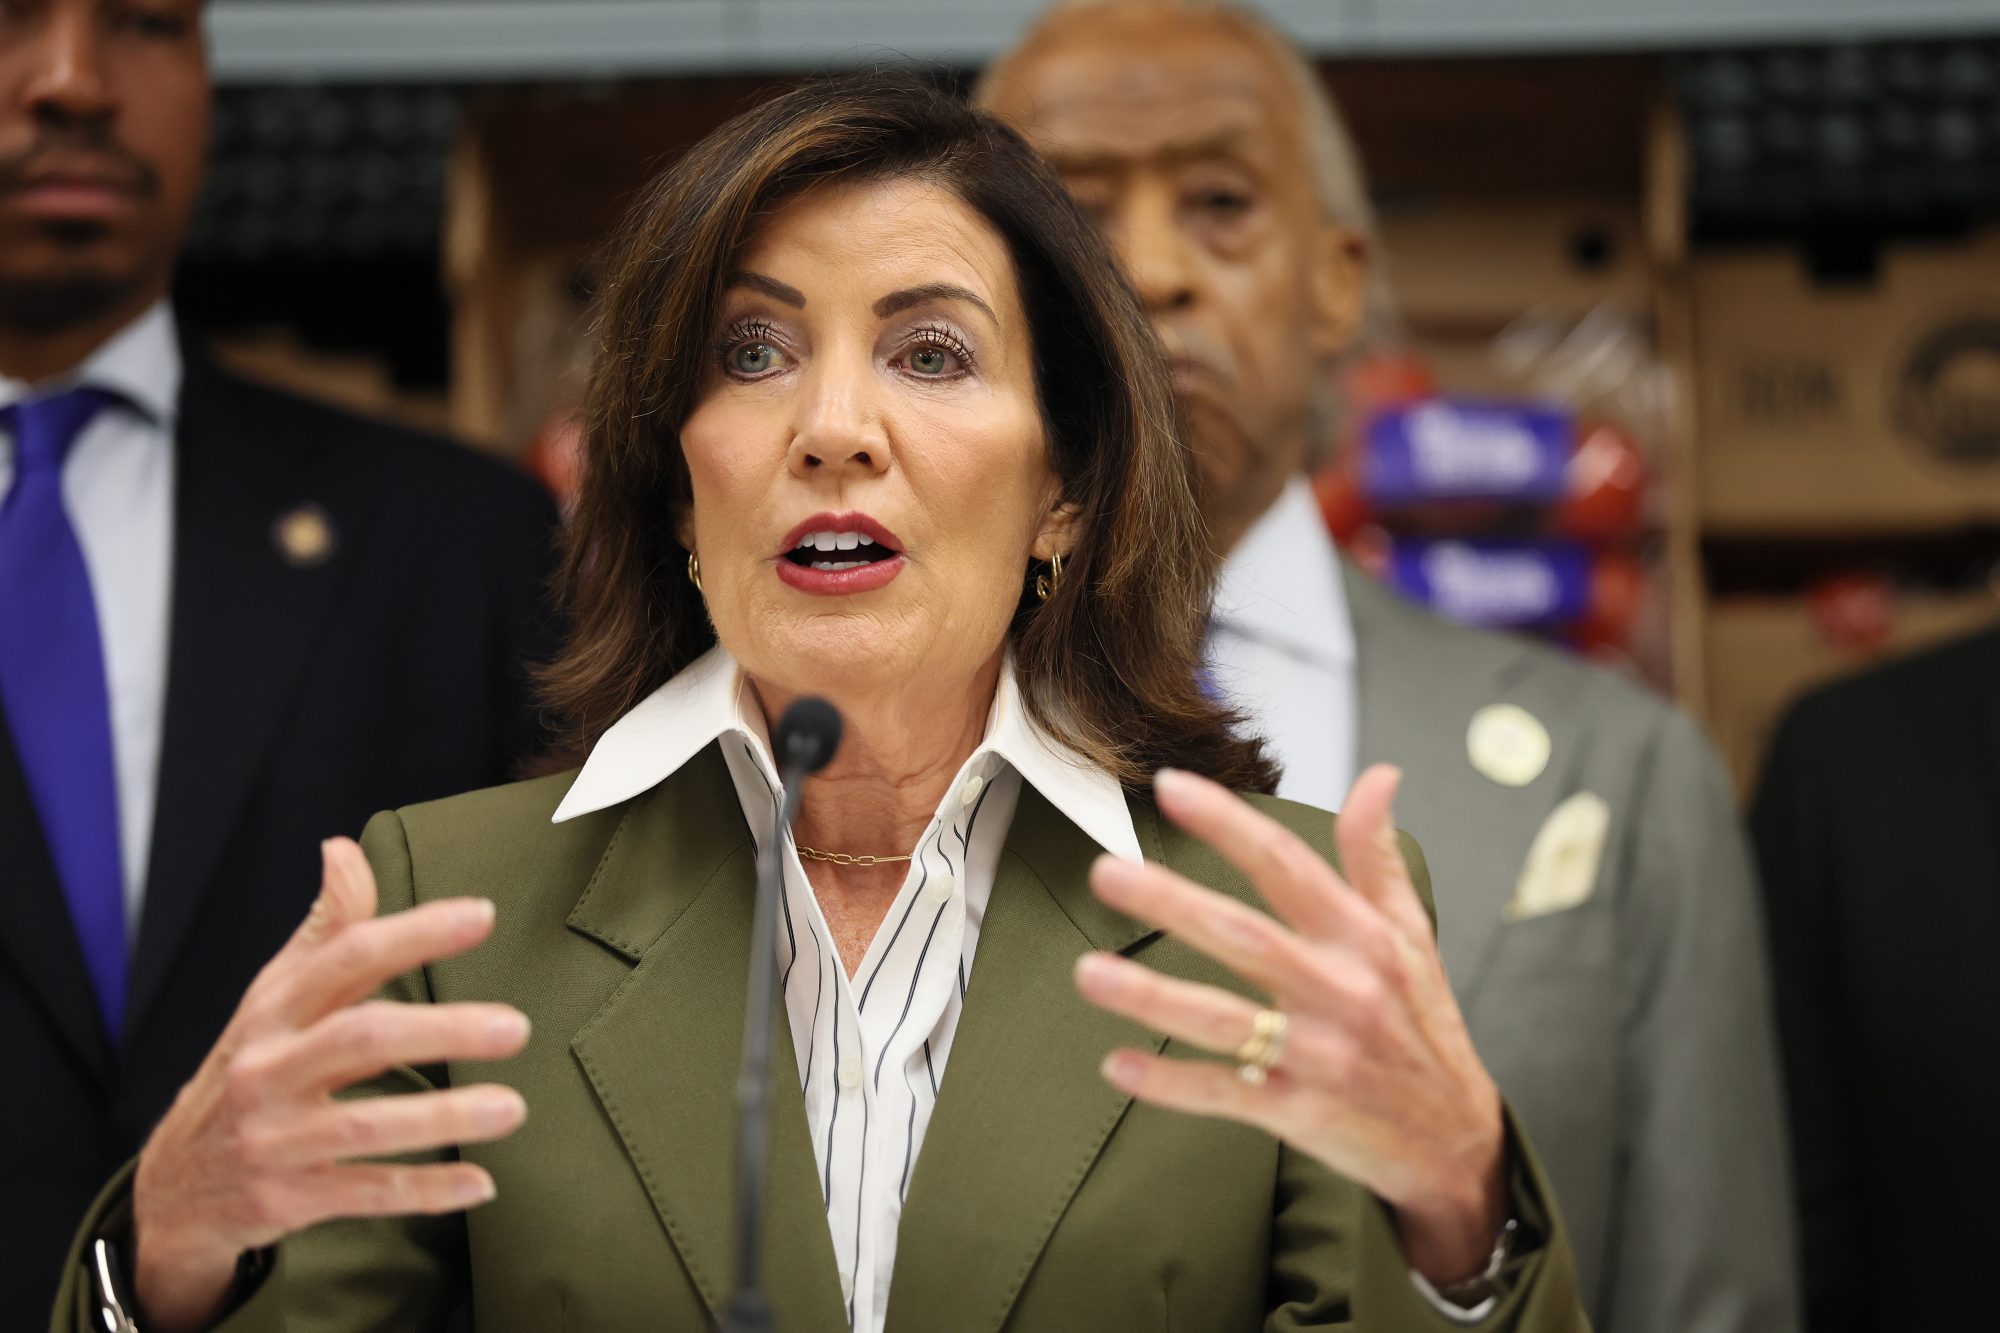
Some Democrats in Albany may be starting to see the risks of New York’s “climate action” laws, but will enough agree to even delay what some call a “suicide pact”? Governor Kathy Hochul says she wants to “review all our options,” including making changes to the state’s 2019 Climate Leadership and Community Protection Act (CLCPA). This law set ambitious mandates to slash greenhouse-gas emissions—mandates critics say are budget-busting and unrealistic.

Some Assembly Democrats who once denied that Hochul was banning gas stoves now admit that’s exactly what she’s doing, and they are demanding a delay to the ban. However, convincing the progressive majority in the Legislature to roll back the law will be tough. Climate change remains a top priority on the left, especially among donors and college-educated voters.

Watch New Jersey closely, where voter anger over soaring electric costs could propel Republican Jack Ciattarelli to the governor’s mansion. Even a close race there may open eyes in Albany. Rising utility bills and the threat of blackouts are already becoming major issues in New York, and Hochul plans to make “affordability” a centerpiece of her 2026 reelection campaign.

“My job is to ensure we have enough power to keep the lights on, keep rates affordable, and attract major economic development projects,” Hochul said after a judge ordered her Department of Environmental Conservation to issue rules ensuring the state meets the 2019 law’s emissions goals.

In other words, she wants to override—or at least ignore—the clear letter of the law, even if she doesn’t explicitly call its mandates into question. “We plan to review all our options, including working with the Legislature to modify the CLCPA,” Hochul said, emphasizing the need “to protect New Yorkers from higher costs.”

Under the CLCPA, New York must cut CO2 emissions by 40% by 2030 and by 85% by 2050. The law also required that rules to achieve those goals be enacted by January 1, 2024. Yet here we are, nearly two years later, and those rules have still not materialized. In effect, Hochul is ignoring the law.

Meanwhile, Assemblyman William Conrad (D-West New York) reports that the state’s no-gas mandate—set to take effect at the end of the year—has already increased construction costs. This threatens affordable housing projects and raises concerns about potential winter blackouts.

Even more troubling, the state’s Climate Action Plan mandates closing natural-gas power plants and replacing them with more expensive, less reliable solar and offshore wind installations—many of which are struggling to get off the ground.

The New York Independent System Operator (NYISO), which runs the state’s electric grid, alongside the New York Affordable Clean Power Alliance, a solar-industry group, warn that the shift to solar and wind poses serious threats to reliable power, particularly in the Hudson Valley, Long Island, and New York City.

How will Governor Hochul prevent blackouts and keep costs down as the power supply tightens? Especially as NYISO notes growing electricity demands from cryptocurrency mining, data centers, and all the “green” mandates requiring electricity for heating, cooking, and vehicles?

The idea that New York can build enough solar and wind power infrastructure in time to meet these mandates was always a long shot—a charade aimed at pleasing climate activists. Yet it is the state’s legal obligation.

As legal deadlines approach or pass without the state fulfilling them, the truth becomes clearer: Making “net-zero carbon emissions” a top priority is not only unrealistic, it is also expensive, risky, and, some argue, misguided.

How many court orders can the governor defy? Can she convince the Legislature to amend the laws and ease the pressure from the courts?

Politicians like Hochul may only focus on timing. The 2026 gas mandates kick in just as reelection campaigns begin. “Don’t bring things to a grinding halt,” suggests Assemblyman John McDonald (D-Rensselaer). Instead, “slow down a little bit and put a temporary pause in there.”

Translation: Wait until after reelection before hitting New Yorkers with higher bills and blackouts. Remember how Hochul delayed congestion pricing until after the 2024 elections?

But reality won’t change after the election. Albany should scrap these mandates entirely and focus on economic growth. Yet Hochul seems likely to push only for delays, and progressives might not even agree to that much. Forget about the bold moves New York truly needs, like opening the state to fracking.

As long as Democrats dominate, it’s hard to see New York having reliable electric power anytime soon—let alone power that is affordable.
https://nypost.com/2025/11/01/opinion/albany-may-move-to-delay-its-insane-climate-laws-but-far-better-to-scrap-it-altogether/

Climate denialists can’t ignore this evidence

The sun rises amid high temperatures in Mexico City on May 23, 2024. Extreme heat across Mexico, Central America, and parts of the U.S. South has left millions sweltering, strained energy grids, and even caused iconic Howler monkeys in Mexico to drop dead from trees.

Every now and then, a piece of evidence emerges that cuts through the noise and changes minds. Zeke Hausfather, a climate scientist at Berkeley Earth, recently produced a stark illustration of how quickly our planet is heating due to greenhouse gases emitted by humans.

In his Substack newsletter, *The Climate Brink*, Hausfather published a chart breaking down the percentage of the world’s land that has experienced its hottest month on record in each decade since the 1870s. The data reveals that very little of Earth’s land surface experienced such temperature records before the 20th century. In contrast:

– Roughly 78% of land set new temperature records in the 21st century.
– 38% of land has already set records in the 2020s — despite the decade being only halfway over.

Put simply, the world is getting hotter, and fast.

This pairs well with another eye-opening chart from the National Aeronautics and Space Administration (NASA), which shows the change in average global surface temperature over the past 145 years. The temperature has risen more or less steadily over the past five decades, recently hitting 1.3 degrees Celsius (about 2.3 degrees Fahrenheit) above the 1951-1980 average.

We are now dangerously close to the stretch goal of the 2015 Paris Agreement, which aims to limit heating to 1.5°C above pre-industrial averages — roughly corresponding to the NASA baseline.

These compelling graphics directly refute at least two major talking points used by climate-change deniers to delay action and perpetuate fossil fuel dependency.

### Debunking Myths

**Myth 1: Climate Change Is a “Greatest Con Job”**

Former President Donald Trump, often regarded as a major climate denier, stated at the United Nations:

> “If you look back years ago, in the 1920s and the 1930s, they said, ‘Global cooling will kill the world. We have to do something.’ Then they said global warming will kill the world, but then it started getting cooler. So now they just call it climate change because that way they can’t miss. Climate change because if it goes higher or lower, whatever the hell happens, there’s climate change. It’s the greatest con job ever perpetrated on the world, in my opinion.”

As the charts clearly demonstrate, while the world may have cooled for some decades after the 1930s, the long-term trend since the 1970s is a steady increase in temperature. In fact, the past 100 years have been the hottest in recorded human history.

Adding to this, a striking chart published in 2023 by Andrew Dessler, a climate scientist at Texas A&M University and co-author with Hausfather at *The Climate Brink*, tracks global temperatures since the last ice age—and projects thousands of years into the future. It illustrates how we are reversing centuries of planetary cooling in the blink of a geological eye. Achieving such a rapid shift requires an unprecedented surge in carbon dioxide emissions, a feat accomplished by human activity.

**Myth 2: The World Was Hotter in the 1930s**

Trump’s Department of Energy recently released a 141-page report attempting to rebut established climate science, suggesting the world was hotter in the 1930s than today. This claim has widely been criticized and debunked.

It is true that the US experienced exceptional heat during the Dust Bowl decade, with heat-wave intensity in the lower 48 states at its highest on record according to Environmental Protection Agency data. Hausfather’s chart shows that about 3% of 1930s temperature records still stand, including some parts of the US.

However, this was a localized anomaly, not a global trend. The Dust Bowl conditions resulted from a combination of bad farming practices that stripped land cover, intensifying drought and heat, compounded by a prolonged spike in ocean temperatures. This “perfect storm” generated excess heat that even reached Europe.

Meanwhile, much of the rest of the world remained relatively cool. The localized heat receded once ocean temperatures dropped and land management improved. Now, the heat is back—not only in the US but globally—as a direct consequence of humanity’s greenhouse gas emissions.

At our current rate, the Dust Bowl era will soon appear as a comparatively cool interlude.

### The Takeaway

Climate change is a global trend, not a localized event or a “con job.” Cherry-picking data to deny this reality is a tactic designed to distract from the urgent work needed to mitigate warming.

Sharing charts like these is just the beginning. Stay informed and connected — understanding the facts equips us to push for meaningful action.

*Mark Gongloff is a Bloomberg Opinion editor and columnist covering climate change. He previously worked for Fortune.com, the Huffington Post, and The Wall Street Journal.*

*Keep it Clean:*

– Avoid obscene, vulgar, lewd, racist, or sexually oriented language.
– Please turn off your caps lock.
– Threats of harm toward others will not be tolerated.
– Be truthful; don’t knowingly lie.
– Treat others with respect—no degrading language.
– Use the “Report” link to flag abusive posts.
– Share your stories and insights; we’d love to hear from you.

*Stay updated—subscribe to The Philadelphia Tribune today!*
https://www.phillytrib.com/commentary/climate-denialists-can-t-ignore-this-evidence/article_302ae6f1-6b09-42eb-8dd1-8dfe710122a1.html

西―東日本で大気不安定 雷や突風、ひょう注意を

西―東日本で大気不安定 雷や突風、ひょう注意を

2025/10/16 6:20(2025/10/16 6:23 更新)

気象庁は16日、西日本と東日本で大気の状態が非常に不安定になると発表しました。同日夜にかけて、落雷や竜巻などの激しい突風、降ひょう、急な強い雨に注意するよう呼びかけています。

発達した積乱雲が近づく兆しがある場合には特に警戒が必要です。気象情報の最新の動向を確認し、安全確保に努めてください。

※この記事は有料会員限定です。残り125文字。7日間無料トライアルあり。

https://www.nishinippon.co.jp/item/1411852/

観測史上最も遅い猛暑日、鹿児島 肝付町35・0度、高温注意を

社会・気象:観測史上最も遅い猛暑日、鹿児島・肝付町で35.0度を記録 高温注意を呼びかけ

2025年10月12日 17:24(17:26更新)

気象庁(東京都港区)によると、高気圧の影響で12日は西日本を中心に季節外れの暑さとなりました。

鹿児島県肝付町肝付前田では最高気温が35.0度に達し、日本の観測史上最も遅い猛暑日(最高気温35度以上)を記録しました。

また、新潟県糸魚川市でも同様の猛暑日となっています。

この季節にしては非常に高い気温となっているため、気象庁は高温に対する注意を呼びかけています。

※この記事は有料会員限定です。残り214文字につきましては、7日間無料トライアル(1日37円)または年払いプランでお読みいただけます。

https://www.nishinippon.co.jp/item/1410504/

夏、42年で3週間伸び121日に 大学がデータ分析し算出、冬は変わらず

2025年10月12日 6:00
【有料会員限定記事】

日本の「夏の期間」が1982年から2023年の42年間で約3週間長くなっていたことが、三重大グループの研究で11日に明らかになりました。

一方で、「冬の期間」はほぼ変わらず、春と秋の期間が短くなることで「二季化」が進んでいることも確認されています。夏の期間は年々延びている傾向にあります。

■ 三重大の分析方法(イメージ)

(ここに分析方法のイメージ図や説明を挿入)

■ 【福岡県内14カ所のヒートマップ】
暑さの変化を可視化 〜6〜8月の平均気温〜

福岡県内14カ所で観測された6月から8月の平均気温をヒートマップで可視化しました。暑さが年々長く、厳しくなっている様子が一目でわかります。

※この記事は有料会員限定です。全文をお読みいただくには、7日間無料トライアルや月額プランのご利用が必要です。
1日あたりわずか37円で読み放題!年払いならさらにお得なプランもございます。

【関連リンク】
▶ 【福岡県内14カ所のヒートマップ】暑さどんどん長く厳しく。6~8月の平均気温を可視化(2025年9月2日掲載)

<西日本新聞meとは?>
(サービス紹介リンクや説明をここに掲載)

(クリップ機能は有料会員のみご利用いただけます)
https://www.nishinippon.co.jp/item/1410362/

【独自】日本の夏、42年で3週間長く 春秋は短く「二季化」進む


title: 【独自】日本の夏、42年で3週間長く 春秋は短く「二季化」進む
date: 2025-10-11 21:00
updated: 2025-10-11 21:01
category: 社会・気象

日本の「夏の期間」が1982年から2023年の42年間で約3週間長くなっていたことが、三重大グループの研究で11日に分かりました。

この研究は、三重大大学院修士2年の滝川真央さんと立花義裕教授が中心となって行ったもので、夏の長期化を詳細に分析しています。

一方、「冬の期間」はほぼ変わらず、春と秋の季節が短くなる「二季化」が進んでいることも明らかになりました。

夏の期間は年々延びている傾向があり、季節の変化や気候に対する影響が懸念されています。

(写真説明)
夏の長期化について研究した三重大大学院修士2年の滝川真央さん(左)と立花義裕教授=9月、津市

※この記事は有料会員限定です。
残り995文字を読むには、7日間無料トライアル(1日37円で読み放題)、または年払いのご利用がお得です。
https://www.nishinippon.co.jp/item/1410316/

Bengaluru Weather Update: IMD Issues Alert In These Regions Of Karnataka; Check Details

**Bengaluru Weather Update: Moderate to Heavy Rainfall Expected on October 8, 2025**

Bengaluru, the capital city of Karnataka, is set to experience moderate to heavy rainfall on Wednesday, October 8, 2025. Cloudy skies are also expected throughout the day, creating a mild and pleasant atmosphere for residents.

The city woke up at 6:09 AM, with minimum and maximum temperatures forecasted to range between 21°C and 27°C respectively. The sunset is expected at 6:09 PM.

According to the Karnataka State Natural Disaster Monitoring Centre (KSNDMC), which shared a detailed seven-day weather report on X (formerly Twitter), scattered light to moderate rain accompanied by strong winds and thundershowers will be widespread across the state. Coastal, Malnad, and South Interior districts are likely to experience heavy rainfall from today through October 12.

**Today’s Air Quality and Humidity**

Humidity levels in Bengaluru are expected to hover around 88%, contributing to the overall moisture in the air. The Air Quality Index (AQI) is forecasted to be approximately 30, indicating good air quality across the city and surrounding areas. This AQI level is expected to remain stable throughout the day.

**IMD Advisory**

The India Meteorological Department (IMD) has issued an advisory warning that the rainfall may cause temporary disruptions to electricity supply. There is also a possibility of minor traffic snarls and the uprooting of weak tree branches due to strong winds.

Residents are advised to stay indoors and ensure that windows and doors remain closed to stay safe during these weather conditions.

**About the Southwest Monsoon**

The Southwest Monsoon is a seasonal wind shift bringing heavy rainfall to South Asia, particularly India, from June to September. This monsoon period is characterized by a reversed wind pattern, with winds blowing from land to sea and vice versa, carrying moisture that results in significant rainfall.

Stay tuned for further updates and take necessary precautions to stay safe in the coming days.
https://www.freepressjournal.in/india/bengaluru-weather-update-for-october-8

India’s Above-Normal Monsoon Brings Mixed Fortunes For Kharif Crops; Excess Rainfall Damages Paddy, Pulses, Cotton

The southwest monsoon 2025 commenced its withdrawal by mid-September. It is now time to evaluate its performance and examine the harvest prospects of key crops across the country.

### Rainfall Overview

The good news is that, as forecast by the India Meteorological Department (IMD), India has enjoyed above-normal rainfall this season. Between June 1 and September 27, the country received 922 mm of rainfall, which is 8 percent above the normal level.

However, the distribution of rainfall was uneven. While east and northeast India—mainly Bihar and Assam—suffered a 19 percent rainfall deficiency, the northwest regions, primarily Punjab and Rajasthan, experienced a 28 percent surplus. Central India received 13 percent above-normal rainfall, and the southern peninsula saw an 11 percent surplus.

### Impact on Agriculture

Although the total quantum of rainfall during the season is important, the temporal and spatial distribution is critical for agriculture. August and September witnessed excessive precipitation in some parts of the country such as Punjab, Maharashtra, Karnataka, and Rajasthan. This has reportedly inflicted crop damage.

There have been reports regarding adverse impacts on paddy and pulse crops, but the full extent of damage is still under assessment. Anecdotal evidence also suggests that excessive rains have impacted crop quality.

Below is an assessment of the likely harvest size of key Kharif crops. The forecast production numbers are presented as ranges, with planted area data as of September 26.

### Rice

The production target for rice this season is 123 million metric tonnes (MMT). The normal planted area, based on a five-year average, is 40.3 million hectares (ml ha). This year, the planted area was slightly higher at 44.2 ml ha, compared to last year’s 43.6 ml ha.

The rice crop is estimated to yield between 123 and 125 MMT, up from 121.8 MMT in 2024. Rice stocks in the country remain well above the buffer norm, and export restrictions have been lifted.

### Maize

The production target for maize is 26 MMT. Planted area expanded significantly this season to 9.5 ml ha, up from 8.8 ml ha last year, following increased demand for ethanol production driven by the government’s biofuel blending programme.

The maize harvest is expected to be in the range of 26 to 27 MMT, higher than the 24.8 MMT produced during the last Kharif season.

### Pulses

This protein-rich legume has faced challenges this year. The production target was reduced from 9.5 MMT in 2024 to 8.0 MMT in 2025. Planted area has also declined by one million hectares to 12.0 ml ha, down from a five-year average of 13 ml ha, as growers shifted to more remunerative crops like maize due to poor returns.

Despite satisfactory initial rains, excessive rainfall in August in pockets of Maharashtra and Karnataka damaged crops. Consequently, production is expected to decline to between 6.7 and 7.0 MMT, well below even the reduced target.

To augment availability and keep prices in check, imports of pigeon pea (tur/arhar) and black matpe (urad) have been allowed duty-free until March 2026.

### Oilseeds

Key Kharif oilseeds include soybean and groundnut, along with smaller quantities of sesamum, niger seed, sunflower seed, and castor seed.

The soybean planted area has decreased to 12 ml ha this season, down one million hectares from last year. However, satisfactory rainfall over the soy belt in Madhya Pradesh, Vidharba in Maharashtra, and parts of Rajasthan is expected to result in decent yields.

Soybean production is forecasted between 12.0 and 12.5 MMT, falling significantly short of the 16.2 MMT target. It is widely recognized that the government’s 2024 estimate of 15.2 MMT was overstated by 15 to 20 percent. Effectively, soybean production has seen little change.

In the case of groundnut, the main growing region of Gujarat received excellent rainfall, likely leading to improved yields. The overall production size is projected to be between 11 and 12 MMT, higher than the target of 10.5 MMT and last Kharif’s 10.4 MMT.

### Cotton

Cotton, a multipurpose crop used for fibre, food, and feed, has been losing acreage over the past three years. This season, the planted area has decreased to 11.0 ml ha, down from 11.3 ml ha last year and well below the five-year average of 12.9 ml ha.

Excessive rains in key cotton-growing states such as Maharashtra, Andhra Pradesh, Telangana, and Punjab, coupled with pest infestations, have resulted in crop losses. The government revised the production target down from last year’s 35 million bales (170 kg each) to 33.5 million bales for 2025.

Despite this, the harvest is estimated to be between 29.5 and 30.5 million bales, falling short of even the reduced target. Last year, production stood at 30.7 million bales. Crop quality is also likely to be compromised.

India has now become a net importer of raw cotton, and free imports are allowed until December 31, 2025. For 2025-26, imports are forecast at 3.5 to 4.0 million bales.

### Sugarcane

Sugarcane planted area has steadily expanded and stands at 5.9 ml ha for the 2025-26 sugar year, up from 5.7 ml ha last year and the five-year average of 5.2 ml ha.

Compared with the cane production target of 469 MMT and the 2024 production of 450 MMT, this year’s output could decline to between 440 and 460 MMT due to excessive rainfall in growing areas of Maharashtra and Karnataka.

The government has lifted the December 2023 restriction on diverting cane for ethanol production. After accounting for this diversion, sugar production in 2025-26 is likely to be around 30 MMT, slightly less than last year.

### Looking Ahead

Rains continued in southern and western parts of the country through the end of September, potentially causing more damage and delaying damage assessments. However, the continuing rains are expected to improve soil moisture, benefiting the Rabi planting season, including major crops such as wheat, rapeseed/mustard, and chickpea, which typically commence in late October.

Reservoir storage levels are satisfactory and higher than last year’s, providing a positive outlook for irrigation.

Given the combined production prospects of Kharif crops, ample public stocks of wheat and rice with government agencies, and a liberal import policy for pulses and edible oil, the risk to food inflation is tilted not to the upside, but potentially to the downside.

If Rabi crop prospects prove satisfactory, food prices may remain consumer-friendly. Nevertheless, weather conditions in the coming months will be a critical factor to watch.

**Note:** Except for the forecast of Kharif 2025 crop production (based on G. Chandrashekhar’s proprietary research), all data—including acreage, rainfall, and production targets—are official government figures.

*G. Chandrashekhar is an economist, senior editor, and policy commentator specializing in agribusiness and commodity markets. The views expressed here are personal.*
https://www.freepressjournal.in/analysis/indias-above-normal-monsoon-brings-mixed-fortunes-for-kharif-crops-excess-rainfall-damages-paddy-pulses-cotton

Another chilly night before a summer-like weekend

Last night, temperatures cooled off quickly and we can expect a similar trend tonight, with many towns dropping into the 30s for overnight lows. There is a chance of some patchy frost in areas north and west of 495.

This fall-like air we’ve experienced over the last two days will be short-lived. By the weekend, it’s going to start feeling more like summer again! Tomorrow will have a chilly start, but we’ll warm up nicely under plenty of sunshine.

Average highs are now in the upper 60s, but we should be able to reach the low 70s tomorrow afternoon, beginning that upward temperature climb. And it doesn’t stop there! After two days in the 60s, we’ll see highs in the 70s tomorrow, followed by 80s this weekend and into the early part of next week.

Reaching 80 degrees in October isn’t unusual—in fact, we typically hit 80 once each October. However, if we manage to have four days in the 80s, that would be a bit unusual. Some days, especially along the coastline, may not quite make it to 80, with Saturday’s temperatures likely holding in the mid to upper 70s.

We’ll continue with this sunny trend through early next week. The 80-degree temperature statistics referenced are for Boston specifically.
https://whdh.com/weather-blog/another-chilly-night-before-a-summer-like-weekend/

Mumbai Weather Update: IMD Issues Red Alert For Extremely Heavy Rainfall; Thane, Raigad Also On High Warning

**Mumbai Braces for Extremely Heavy Rainfall Amid Navratri Celebrations**

As Mumbai joyfully celebrates the Navratri festival, residents are advised to stay alert due to a Red Alert issued by the India Meteorological Department (IMD) forecasting extremely heavy rainfall accompanied by thunderstorms and lightning.

### Red Alert in Effect from Sunday to Monday Morning

The Red Alert is active from Sunday through Monday morning for Mumbai and its neighboring districts of Raigad and Thane. This alert indicates the likelihood of extremely heavy rainfall in isolated pockets, posing potential risks to the public.

Following the Red Alert, an Orange Alert has also been issued as a precautionary measure to ensure preparedness across the affected areas.

### Palghar Under Red Alert for Two Consecutive Days

Palghar district has been placed under a Red Alert for both Sunday and Monday due to forecasts predicting intense rainfall. Residents in this region are advised to remain cautious and stay tuned to weather updates.

### Weather Systems Driving the Rainfall Surge

The surge in rainfall activity across Maharashtra is attributed to a low-pressure area over the Bay of Bengal. According to the IMD, this system is expected to move westward and intensify into a depression within the next 12 hours.

Additionally, a trough extends from this low-pressure area toward the south Maharashtra coast. An IMD scientist explained, “The combined effect of these weather systems is likely to bring an increase in rainfall over Maharashtra between September 26 and 30.”

### Recent Rainfall Data Across Mumbai

Between Friday and Saturday morning, under a Yellow Alert, Mumbai recorded significant rainfall. The Colaba station received 54 mm of rain, while the Santacruz observatory recorded 12 mm.

Data from the BMC’s automatic weather stations between 8:00 am Friday and Saturday show the island city recorded an average of 30.07 mm of rainfall. The eastern suburbs saw 26 mm on average, while the western suburbs received approximately 10 mm.

Despite the Orange Alert on Saturday, the city experienced heavy showers in isolated locations throughout the day.

### September Rainfall Surpasses Monthly Average

The monthly average rainfall for September in Mumbai is 380 mm. However, this month has already seen 445 mm of rain, surpassing the average, indicating a wetter-than-usual monsoon season.

For more details on exclusive and budget-friendly property deals in Mumbai and surrounding regions, visit: [https://budgetproperties.in/](https://budgetproperties.in/)
https://www.freepressjournal.in/mumbai/mumbai-weather-update-imd-issues-red-alert-for-extremely-heavy-rainfall-thane-raigad-also-on-high-warning